LCD-Plasma Display Technology Shoot-Out
Dr. Raymond M. Soneira
President, DisplayMate
Technologies Corporation
Copyright © 1990-2009 by DisplayMate
Technologies Corporation. All Rights Reserved.
This article, or any part thereof, may not be copied, reproduced, mirrored,
distributed or incorporated
into any other work without the prior written permission of DisplayMate
Technologies Corporation
Introduction
If you were shopping for a large-screen HDTV just a few years ago
you would have seen mostly Rear Projection HDTVs, based primarily on DLP, LCD
and LCoS technologies, plus a fair number of pricey direct-view Plasmas, and
maybe a few very expensive direct-view LCDs. It’s amazing how the TV industry
has abruptly toggled into an entirely different lineup. Now you’ll see mostly
direct-view LCDs together with a small number of Plasmas. If you look in some
back corner you may find a few attractively priced Rear Projection DLP HDTVs.
CRT and LCoS technologies are now dead for HDTVs, and Rear Projection is “a dead
man walking.”
Scientifically, it’s hard to understand why this happened because
CRT, LCoS and DLP offered the highest picture quality at the lowest price,
while direct-view large-screen LCDs have historically offered the lowest
picture quality at the highest price. This seems to be the result of a series
of consumer misconceptions together with some high powered industry marketing.
Of course, all of the display technologies have improved dramatically over the
last few years, so we decided to revisit this topic and do a new in-depth
Shoot-Out comparison and analysis of LCD and Plasma technologies to find out
how they are currently performing.
Figure 1 shows 11 HDTVs in the DisplayMate Technologies Demo Lab.
Included are two Plasmas, eight LCDs, and one CRT Sony Professional HD
Trinitron Studio Monitor, which was used as the reference standard. This was an
in-depth scientific study that included precise calibrations, comprehensive
spectroradiometer measurements, and a large number of jury panelists that viewed
test patterns, test photos, and lots of high quality High Definition video
material. The Shoot-Out was a large operation that was jointly produced by
DisplayMate Technologies (www.displaymate.com)
in collaboration with Insight Media (www.insightmedia.info),
however, all of the technical analysis was done by the author.
The HDTVs included models from the top-tier brands of
(alphabetically) LG, Panasonic, Samsung, Sharp and Sony - from the mid-line to
top-of-the-line models. All of the units were from the 2008 model year.
Differences between the 2008 and 2009 models are primarily in their marketing
hype. For this article we will concentrate on three flagship top-of-the line
LCD models from Samsung (LN-T5281F), Sharp (LC-52D92U) and Sony (KDL-52XBR4),
and a flagship top-of-the-line Plasma unit from Panasonic Professional
(TH-50PF10UK). By concentrating on the top-of-the-line models from the market
leaders we are assured of examining the state-of-the-art for each display
technology and each manufacturer.
FIGURE 1
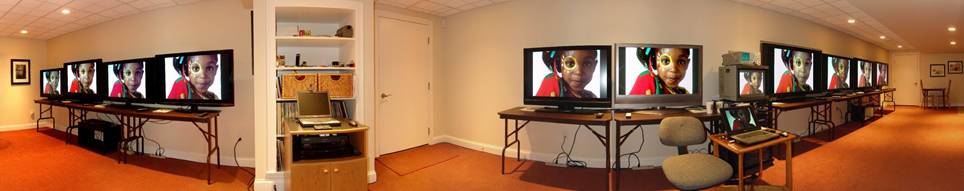
Figure 1.
The LCD-Plasma Shoot-Out with the lights turned on.
Photograph by Dieter Michel, Publisher of PROSOUND and
Medientechnik & Systemintegration Magazines, Germany.
Features and Specifications
The units compete primarily on features and
specifications in addition to price. Readers that regularly follow HDTV reviews
will not be surprised to learn that after extensive testing, measurements and
analysis we found that the units delivered their best picture quality with all
of their much-hyped advanced features, which are essentially marketing
gimmicks, turned off. In particular, all of the settings that dynamically
process the image were disabled, such as Dynamic Backlight, Dynamic Contrast,
Dynamic Black, Dynamic White, and Dynamic Color. They all reduce picture
quality and accuracy and introduce ugly image artifacts. Note that you
generally won’t find them with these generic names because they are all promoted
as exclusive proprietary features with their own catchy marketing names.
In the next article in this series we will discuss Response Time
and Motion Blur. Similarly, in all cases we found that the advanced motion
processing enhancement options introduced lots of motion artifacts without
notably improving motion blur, so we turned all of those features off as well.
The real battle lines, however, are in the specifications
published by the manufacturers themselves, because consumers, corporate and government
buyers frequently pick a unit based on the advertised specs, even though very
few people understand how they are measured or even what they actually mean.
Unfortunately, most of the specs are actually marketing tools rather than a set
of scientifically objective tests and measurements. Previous articles in the
Display Technology Shoot-Out series have examined many of these specs and
issues. Here we continue with an in-depth analysis of Dynamic Contrast, Viewing
Angles, Extended Color Gamuts, and in Part 2 on Response Time and Motion Blur.
Set
Up and Calibration
The units were all set up, calibrated and compared side-by-side in
a Shoot-Out configuration. All of the HDTVs were fed identical digital HDMI
signals, simultaneously showing identical high quality all-digital 1080p
content. The calibrations were all done with DisplayMate Multimedia Edition
test patterns and a Konica Minolta CS-200 Spectroradiometer for accurate
photometry and colorimetry measurements. Refer to earlier articles in this
Display Technology Shoot-Out series, which are now all available together on www.displaymate.com, for in-depth
discussions and explanations.
Sony and Panasonic Units
The Sony and Panasonic units required very little effort
to nudge into excellent agreement with the HDTV Rec.709 standard, with accurate
primary chromaticities, a D6500 White Point, and an accurate intensity scale
with an accurate 2.2 Gamma, which will all be discussed in greater detail
below. The calibrations for both units were so close that it was frequently
impossible to visually tell them apart. Except… when viewing the Sony LCD
slightly off angle, or when there was dark content, or when there was
significant motion in the picture. The Panasonic Plasma performed best in all
of these areas. The differences were amazing and astonished everyone that came
to see and compare them side-by-side. More on that below…
Sharp and Samsung Units
If you had no other source for comparison, then the
top-of-the-line Sharp unit might look reasonably good. But next to all of the
other flagship HDTVs, including the reference Studio Monitor, it looked
significantly worse than all of the other units. The colors, hues, saturations,
and intensity scales were way off and there were lots of noticeable ugly
artifacts. We started to do a low-level service mode recalibration, but in the
end found it to be a pointless exercise and the unit was returned to the
original factory settings. So the Sharp unit was punished and sent to the corner
where it was mostly ignored.
The Samsung unit was quite good, but definitely a step down in
color and gray-scale accuracy from the Sony and Panasonic units. Its most
distinctive features were Dynamic LED backlighting together with zoned LED
Local Dimming. We turned these features off because they introduced intensity
scale errors and ugly halos in scenes with dim content. A challenging test for
HDTVs with Dynamic Backlights and Local Dimming is Chapter 14 of 2001: A
Space Odyssey, which includes the trip through hyperspace. For portions of
this chapter the Samsung unit decided that the star fields and other content
were not worth seeing and just showed an entirely black screen. This is because
the dimming algorithms are based primarily on the Average Picture Level, which
can be very low but still contain important content that needs to be shown and
seen.
Photometry and Colorimetry
The only way that an HDTV will deliver good color and gray scale
accuracy is if it is accurately calibrated to an industry standard
specification, which for digital HDTVs is ITU-R BT.709, and is frequently
referred to as Rec.709. If you want to see exactly what the director or content
producer saw at the studio, then make sure that your HDTV is properly
calibrated. This includes an accurate set of primary colors, an accurate white
point, and an accurate intensity and brightness scale, which is called the
Transfer Function and Gamma. See earlier articles in this series for in-depth
explanations.
One common misconception that is frequently exploited by many
manufacturers is that a wider color gamut indicates a better TV that produces
more realistic colors. This is absolutely wrong because a larger color gamut
will simply make all of the screen colors appear more saturated than they ought
to appear on a calibrated standard HDTV. Wider color gamuts decrease color
accuracy and should be avoided except in specialized imaging applications – for
example in medical or military applications. If you do get an HDTV with an
extended color gamut it will be necessary to reduce the color gamut back to the
Rec.709 standard values by using the color saturation control or other color
management functions within the unit, so it is a pretty useless feature in
current HDTVs. It’s just a premature technology being used as a marketing
gimmick! Much more on this topic below…
Figure 2 shows the CIE 1976 Uniform Chromaticity Diagram with the
measured primary colors for the Sony unit. The black triangle is the Rec.709
standard and the red dots are the measured values for the Red, Green and Blue
primary colors, which all fall exactly where they should on the triangle
vertices. This is quite impressive because the Sony values are virtually
indistinguishable from perfect! The other flagship HDTVs were pretty good, but
not quite as accurate.
FIGURE 2
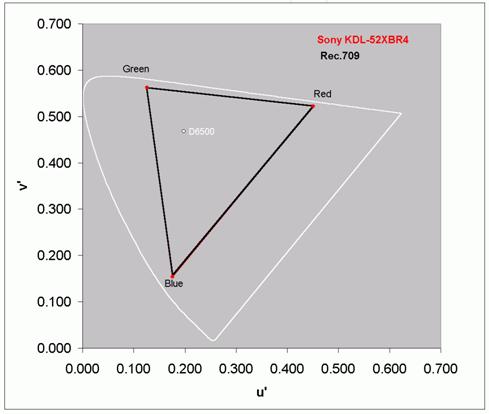
Figure 2.
CIE 1976 Uniform Chromaticity Diagram for the Sony unit.
Getting the primary colors exactly right is fairly easy, even
though most manufacturers seem to be unable to do so. It’s actually a lot
harder and much more important to get the brightness-intensity scale exactly
right. When the brightness-intensity scale is wrong the relative mixtures of
the Red, Green and Blue primary colors that are used to generate all of the
on-screen colors will always turn out wrong. When that happens you may be able
to adjust some of the colors in a picture to come out right, but then lots of
other colors will turn out wrong, so the picture never looks right.
After performing careful calibrations on all of the units, Figure
3 shows the resulting Transfer Function intensity scales for all four HDTVs
together with a perfect mathematical power-law Gamma of 2.2, shown in black.
Note that the plotted scales are both logarithmic, which is necessary to
properly display the desired power-law relationship. Screen Brightness is on
the vertical scale and signal intensity is on the horizontal scale. See the
earlier articles for detailed descriptions and explanations. The Sharp unit was
way off, particularly at low intensities. This was probably done intentionally
to make the unit appear to have a deeper and blacker contrast, but it leads to
all sorts of artifacts and color errors. Although it is hard to see on this
scale, which covers a range of more than 200:1 in brightness, the Samsung unit
initially falls more slowly, and is consistently above the Gamma 2.2 line down
to about 20 percent intensity, and then it falls faster, probably for the same
reasons as the Sharp. The Panasonic and Sony units track each other and the
Gamma 2.2 line fairly well over a brightness range of about 100:1. That is why
they are virtually indistinguishable for both color mixtures and brightness
scales. Note that the dim part of the intensity scale is regularly used, even
when mixing bright colors that often require only a small amount of one or more
of the primaries to get the desired on-screen color, so if the intensity scale
is wrong anywhere then the colors are wrong everywhere!
FIGURE 3
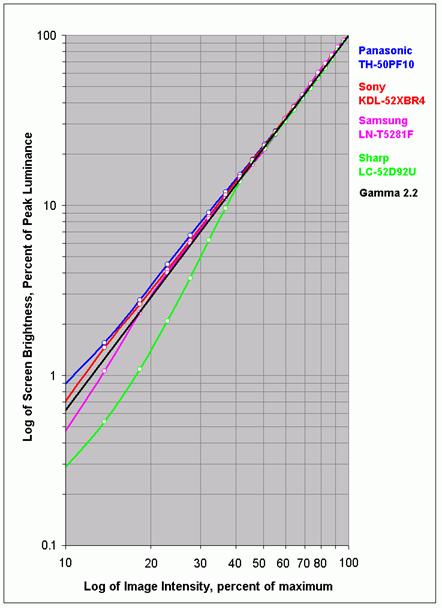
Figure 3.
The Transfer Functions for the four HDTVs together with the standard Gamma of
2.2 in black.
Sony is the only major HDTV manufacturer that seems to be able to
deliver a fairly accurate calibration across most of its product lines once you
take the units out of their factory default Vivid mode and set them to a Cinema
or Custom mode. Surprisingly, most HDTV manufacturers do not know how to
accurately calibrate an HDTV on a factory assembly line. There are some
manufacturers that can, but choose not to do so because they consider it too
expensive and time consuming, or they decide to instead produce an exaggerated
and punchy picture in a misguided attempt to stand out from the crowd.
Now that many HDTVs are coming with USB ports for Digital Cameras,
absolute color and gray scale accuracy will finally become an absolute
necessity because family viewers know exactly how all of the people, colors,
clothing, and objects in their photos should look, and will be angry at the
manufacturer if they do not show up accurately on their HDTV.
Brightness and Contrast Ratio
In the spec wars,
Brightness and Contrast Ratio seem to be the most important numbers for both
consumers and manufacturers. Unfortunately, both of these specs are
significantly misunderstood as well as significantly abused and exaggerated.
The values published by most manufacturers are now so outrageous that they are
close to absolute nonsense, and it’s getting worse. Here’s why…
Throughout this
series we have measured the Brightness and Contrast values using a consistent
and scientifically objective procedure. See earlier articles for an in-depth
discussion and explanation. Briefly, here is their significance: you need to
have a sufficient amount of brightness for comfortable viewing in your ambient
light viewing conditions, but after that more is not better, in fact, for some
display technologies it is actually worse. Contrast Ratio is affected primarily
by how dark and close to black the screen can get, but that is only important
under low ambient lighting conditions. Note that it is only possible to obtain
high picture quality and accuracy under low ambient lighting. In that case you
need moderate brightness and a high Contrast Ratio. For high ambient lighting,
you need high brightness, but don’t worry about picture quality or accuracy or
Contrast Ratio, because they are all irrelevant under these viewing conditions.
Table 1 summarizes
the principal photometry measurements for the HDTVs. The Highest Calibrated
Luminance is the maximum brightness that the unit can produce while calibrated
as described above. For the LCDs, this was obtained from the highest Backlight
setting available. For side-by-side comparisons the Backlight for each of the
LCD units was adjusted to provide a comparable and comfortable Luminance of
about 200 cd/m2. Note that this is
actually a bit on the high side for low ambient light viewing without causing
eye strain, but is still lower than the settings many consumers are likely to
use.
Table 1: Photometry and Colorimetry Measurements Summary
|
|
Highest Calibrated
Luminance
|
Peak Luminance Setting
Used
|
True Contrast Ratio
|
Correlated Color
Temperature
|
|
Panasonic Plasma
|
186 cd/m2
|
186 cd/m2
|
3,842
|
6499 K
|
|
Samsung LCD
|
427 cd/m2
|
189 cd/m2
|
1,877
|
7035 K
|
|
Sharp LCD
|
307 cd/m2
|
192 cd/m2
|
1,330
|
7334 K
|
|
Sony LCD
|
362 cd/m2
|
202 cd/m2
|
1,344
|
6495 K
|
The above are the scientifically objective values, but you may see
brightness specs of 1000 cd/m2 or more, which if true would be
dangerous to view indoors without sunglasses. It’s pointless to bother
explaining how these fictitious values are obtained. But the biggest
exaggerations are now with Contrast Ratio, obtained by inventing a new
so-called “Dynamic Contrast.” In 2008 many TVs were advertised with a “Dynamic
Contrast” in the range of 15,000 to 35,000. In 2009 they are now up to as high
as 100,000, but there is no real improvement, it’s the same trick with a bigger
exaggeration. Here is how it is done, it’s quite simple: when the video signal
is black or very close to black the TV electronics goes into a special standby
mode that significantly reduces the light output of the unit (but it generally
can’t go too low because then it takes longer to emerge from standby when a
non-black picture returns). This dark standby value is then used when computing
the Contrast Ratio instead of the real dark value when a picture is present.
This does not change the Black Luminance or the Contrast Ratio for any picture
that is not all black, so it is absolutely meaningless for picture quality. The
primary reason for including this feature is that the published Contrast Ratio
goes from about 1,500 up to 15,000 to 35,000 or more.
Viewing Angles
Another important and prominently advertised specification is the
range of acceptable Viewing Angles for a TV. For virtually all HDTVs the
published values are at least 176 degrees (or ±88 degrees) out of a possible
180 degrees (±90 degrees). Viewing Angle is especially important for HDTVs
because the audience may be seated at significantly different viewing locations
throughout a room. So according to this claim, unless you are seated at a ridiculous
2 degrees from the edge of the screen you will see a perfectly fine picture.
For all current LCDs this is absolute nonsense. What we found in both the
measurements and viewing tests is that for LCDs the Viewing Angle where there
is noticeable picture degradation is a mere ±10 degrees, not ±88 degrees. Let’s
see how this all comes about. There are three major issues or problems:
The first problem is that the industry standard Viewing Angle
specification for LCDs is based on the angle where the Contrast Ratio falls to
10, which is a ridiculously low value because these units have Contrast Ratios
of about 1,500 when viewed face on. Let’s see how the Contrast Ratio varies
with Viewing Angle.
We
measured the Peak White and Black Luminance values for the HDTVs at a moderate
45 degree angle and then recomputed the Contrast Ratios for each of the units.
The values are listed in Table 2. At 45 degrees the Panasonic Plasma was down
by a moderate 9 percent, but the LCD units were down by enormous factors of 2.9
to 7.6. What happens for LCDs is that the Peak White Luminance decreases with
viewing angle while the Black Luminance increases with viewing angle. Both of
these effects reduce the Contrast Ratio. The Black Luminance values are listed
in Table 3. Plasma displays behave very similarly to CRTs and deliver a Peak
White Luminance and Black Luminance that is fairly independent of Viewing
Angle. The Black Luminance actually decreases a bit with angle for the Plasma
unit because of an anti-reflection absorbing layer on the screen.
Table 2: True
Contrast Ratio with Viewing Angle
|
|
0 Degrees
|
45 Degrees
|
Panasonic Plasma
|
3,842
|
3,502
|
|
Samsung
LCD
|
1,877
|
462
|
|
Sharp
LCD
|
1,330
|
174
|
|
Sony
LCD
|
1,344
|
467
|
Table 3: Black
Luminance with Viewing Angle
|
|
0 Degrees
|
45 Degrees
|
Panasonic Plasma
|
0.07 cd/m2
|
0.06 cd/m2
|
|
Samsung
LCD
|
0.11 cd/m2
|
0.28 cd/m2
|
|
Sharp
LCD
|
0.15 cd/m2
|
0.61 cd/m2
|
|
Sony
LCD
|
0.15 cd/m2
|
0.28 cd/m2
|
The second issue is that the eye is much more sensitive to
variations in color than the luminance values used to determine the Contrast
Ratio variation. So, while some pictures with very bright and saturated colors
may be considered viewable at ±45 degrees, more typical pictures that include a
wide range of intensities, hues and saturations will appear significantly
degraded at much smaller viewing angles.
Figure 4 shows the variation in color with Viewing Angle for each
of the tested units. This effect is due to the fact that for bright LCD
sub-pixels the brightness decreases with Viewing Angle and for dim sub-pixels
the brightness increases with Viewing Angle, which can in some cases lead to
contrast reversal. Since this occurs independently for each of the Red, Green,
and Blue sub-pixels that produce the entire gamut of colors seen on-screen, it
leads to a rather complex behavior of brightness and color variation with
Viewing Angle. Color mixtures show the greatest variations with angle, but
displays are engineered so that things balance out for whites and grays, which
are particular mixtures of all of the primary colors together.
The eye is much more sensitive to reds and greens than blues, so
we’ve picked a sample color with a mixture of 100% red and 50% green to measure
and analyze, which is an orange color that has roughly equal luminance
contributions from both red and green. The results are based on
spectroradiometer measurements and presented in terms of MPCD Minimum Perceptible
Color Difference or JNCD Just Noticeable Color Difference, where 1 MPCD = 1
JNCD = Δ(u’v’) = 0.0040 on the CIE 1976 Uniform Chromaticity Scale. Values
less than 1 are visually indistinguishable, while values much greater than 1
are blatantly different.
FIGURE 4
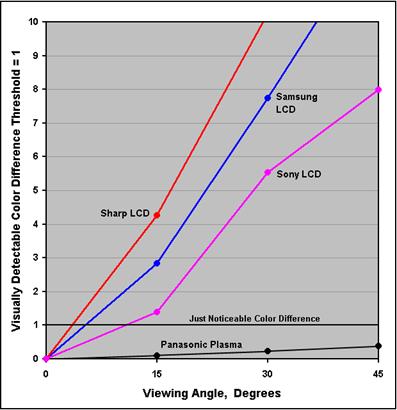
Figure 4. Color mixture
color shifts with angle
All of the LCD units have a noticeable color shift at less than ±15
degrees, while the Panasonic Plasma is visually indistinguishable from face on
viewing well beyond ±45 degrees. This is true for both the measurements and the viewing
tests. The significance of this is enormous, because it means that the “sweet
spot” for seeing an accurate picture on an LCD HDTV is only one person wide,
even for these top-of-the-line models, so essentially everyone looking at an
LCD HDTV will see a picture with noticeably different coloration.
Third: unfortunately, it gets even worse for LCD HDTVs
that have an Extended Color Gamut, such as the Sony and Samsung units, which
show additional and much stronger Viewing Angle artifacts than LCDs with a
standard HDTV color gamut, such as the Sharp unit. Right now there is
essentially no commercially available content with an Extended Color Gamut, so
this feature is just a marketing gimmick. But a gimmick with a significant
penalty for all of the current content with a Standard Color Gamut. This is
because the standard HDTV primary colors for these units must be generated as
color mixtures of the native extended gamut primary colors, and those color
mixtures then vary with viewing angle just like the other colors. As a result a
much larger fraction of the HDTV color gamut shows a strong variation with
angle. The Sharp unit does not have an extended color gamut and as a result
performed much better with primary colors than both the Sony and Samsung units.
Figure 5 repeats the measurements and analysis with angle for the pure Red and
Green HDTV primary colors in order to examine the effect of Extended Color
Gamuts. The Sharp LCD and Panasonic Plasma have only a small shift in primary
color chromaticity with angle, while the Sony and Samsung units both show very
large variations with angle.
FIGURE 5
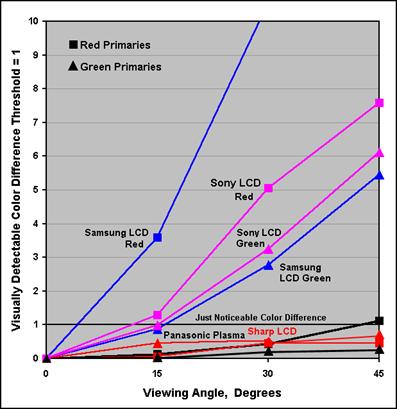
Figure 5. Primary color
shifts with angle
The viewing tests were even more dramatic than the above
measurements might suggest. The differences were amazing and astonished
everyone that came to see and compare the HDTVs side-by-side, including
industry experts, manufacturers, engineers, reviewers, journalists, and ISF
instructors. Everyone knew there were viewing angle effects, but our
side-by-side tests showed how incredibly large they actually are. The best
examples were the two units with the best picture quality: the Sony LCD and the
Panasonic Plasma, which were set right next to one another. Their calibrations
were both so close that it was frequently impossible to visually tell them
apart. But that was true only when standing exactly dead center in front of the
Sony unit. Shifting left or right by just one foot at an optimum viewing
distance of 7 feet caused the Sony LCD unit to appear noticeably different from
the Panasonic Plasma unit next to it, which delivered a consistent picture
independent of viewing angle. This same effect also applies to vertical viewing
positions and angles, so don’t even think about mounting your LCD HDTV above
the fireplace! Make sure that the center of the TV is close to your normal
viewing eye level.
The shocking conclusion is that only one person at a time can see
accurate color reproduction on a direct-view LCD HDTV, even on top-of-the-line
units from the top manufacturers. Even when viewers are seated close together
side-by-side, each person will see a different picture with noticeably
different coloration. On the other hand, Plasma displays deliver very close to
true 180 degree (±90 degree) viewing, the same as traditional CRT monitors.
There is very little change in brightness, contrast, hue, or color saturation
over the entire 180 degree viewing area.
A rather interesting method that we used to demonstrate these
effects was to have people walk past the lineup of HDTVs shown in Figure 1
while simultaneously viewing and comparing static photographs on all the HDTVs,
and then seeing how the units drifted in and out of color accuracy as they
walked by each unit. Static photographs are crucial for evaluating picture
quality and accuracy because they stay the same throughout the entire test,
whereas live video is constantly changing so a detailed comparison and
evaluation, even between two units, can not be done using that method.
Figure 6 is a set of photographs taken at 0 and 45
degrees in front of the Panasonic Plasma and the Sony and Sharp LCD units.
These screen photographs demonstrate the change in color with viewing angle for
the test units. When viewed in person the differences were much more pronounced
than they appear here in these printed thumbnails, which are affected by the
Transfer Function of the camera and the printing process.
FIGURE 6
“Red Door” – On-axis color is good, but shifts to
orange in the off-angle LCD. Photographer Don Cochran.
Panasonic
Plasma Sony LCD


“Girl with Painted Face” – Note the change in the skin color in the off-angle
LCD. Photographer Steve Kelly.
Panasonic
Plasma Sharp LCD

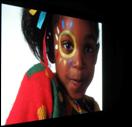

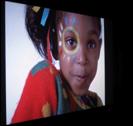
Figure 6. Photographs at 0 and 45 degrees of the Panasonic Plasma and Sony
and Sharp LCD units.
About the Author
Dr. Raymond Soneira
is President of DisplayMate Technologies Corporation of Amherst, New Hampshire,
which produces video calibration, evaluation, and diagnostic products for
consumers, technicians, and manufacturers. See www.displaymate.com. He is a research
scientist with a career that spans physics, computer science, and television
system design. Dr. Soneira obtained his Ph.D. in Theoretical Physics from
Princeton University, spent 5 years as a Long-Term Member of the world famous
Institute for Advanced Study in Princeton, another 5 years as a Principal
Investigator in the Computer Systems Research Laboratory at AT&T Bell
Laboratories, and has also designed, tested, and installed color television
broadcast equipment for the CBS Television Network Engineering and Development
Department. He has authored over 35 research articles in scientific journals in
physics and computer science, including Scientific American. If you have any comments or questions about the
article, you can contact him at dtso.info@displaymate.com.
Article Links: LCD Response Time
and Motion Blur
Display
Technology Shoot-Out Article Series Overview and Home Page
Copyright © 1990-2009 by DisplayMate
Technologies Corporation. All Rights Reserved.
This article, or any part thereof, may not be copied, reproduced, mirrored,
distributed or incorporated
into any other work without the prior written permission of DisplayMate
Technologies Corporation